The goal of tfnswapi is to provide an easy way for R users to download data from TfNSW Open Data.
Installation
You can install the tfnswapi package from GitHub with:
# install.packages("devtools")
devtools::install_github("asiripanich/tfnswapi")
Examples
Carpark API
library(tfnswapi)
# See what facilities are available

# remove `if (FALSE)` to register your own API key
if (FALSE) {
  tfnswapi_register("<your-api-key>")
}

carparks <- tfnswapi_get("carpark")
#> No encoding supplied: defaulting to UTF-8.
carpark_ids <- names(carparks$content)
names(carpark_ids) <- carparks$content
carpark_ids
#>        Tallawong Station Car Park               Warriewood Car Park
#>                               "1"                              "10"
#>                Narrabeen Car Park                Mona Vale Car Park
#>                              "11"                              "12"
#>                  Dee Why Car Park                West Ryde Car Park
#>                              "13"                              "14"
#>   Sutherland East Parade Car Park               Leppington Car Park
#>                              "15"                              "16"
#>     Edmondson Park South Car Park       Kellyville Station Car Park
#>                              "17"                               "2"
#>      Bella Vista Station Car Park Hills Showground Station Car Park
#>                               "3"                               "4"
#>                 Ashfield Car Park                  Kogarah Car Park
#>                             "486"                             "487"
#>              Seven Hills Car Park               Manly Vale Car Park
#>                             "488"                             "489"
#>                Brookvale Car Park      Cherrybrook Station Car Park
#>                             "490"                               "5"
#>    Gordon Henry St North Car Park                    Kiama Car Park
#>                               "6"                               "7"
#>                  Revesby Car Park
#>                               "9"

# get data of just one carpark
carpark <- tfnswapi_get("carpark", params = list(facility = 2))
#> No encoding supplied: defaulting to UTF-8.
tidied_carpark <- data.frame(
  zone_id = purrr::map_chr(carpark$content$zones, purrr::pluck("zone_id")),
  total_spots = purrr::map_chr(carpark$content$zones, purrr::pluck("spots")),
  occupied_spots = purrr::map_chr(carpark$content$zones, purrr::pluck(list("occupancy", "total")))
)

library(ggplot2)
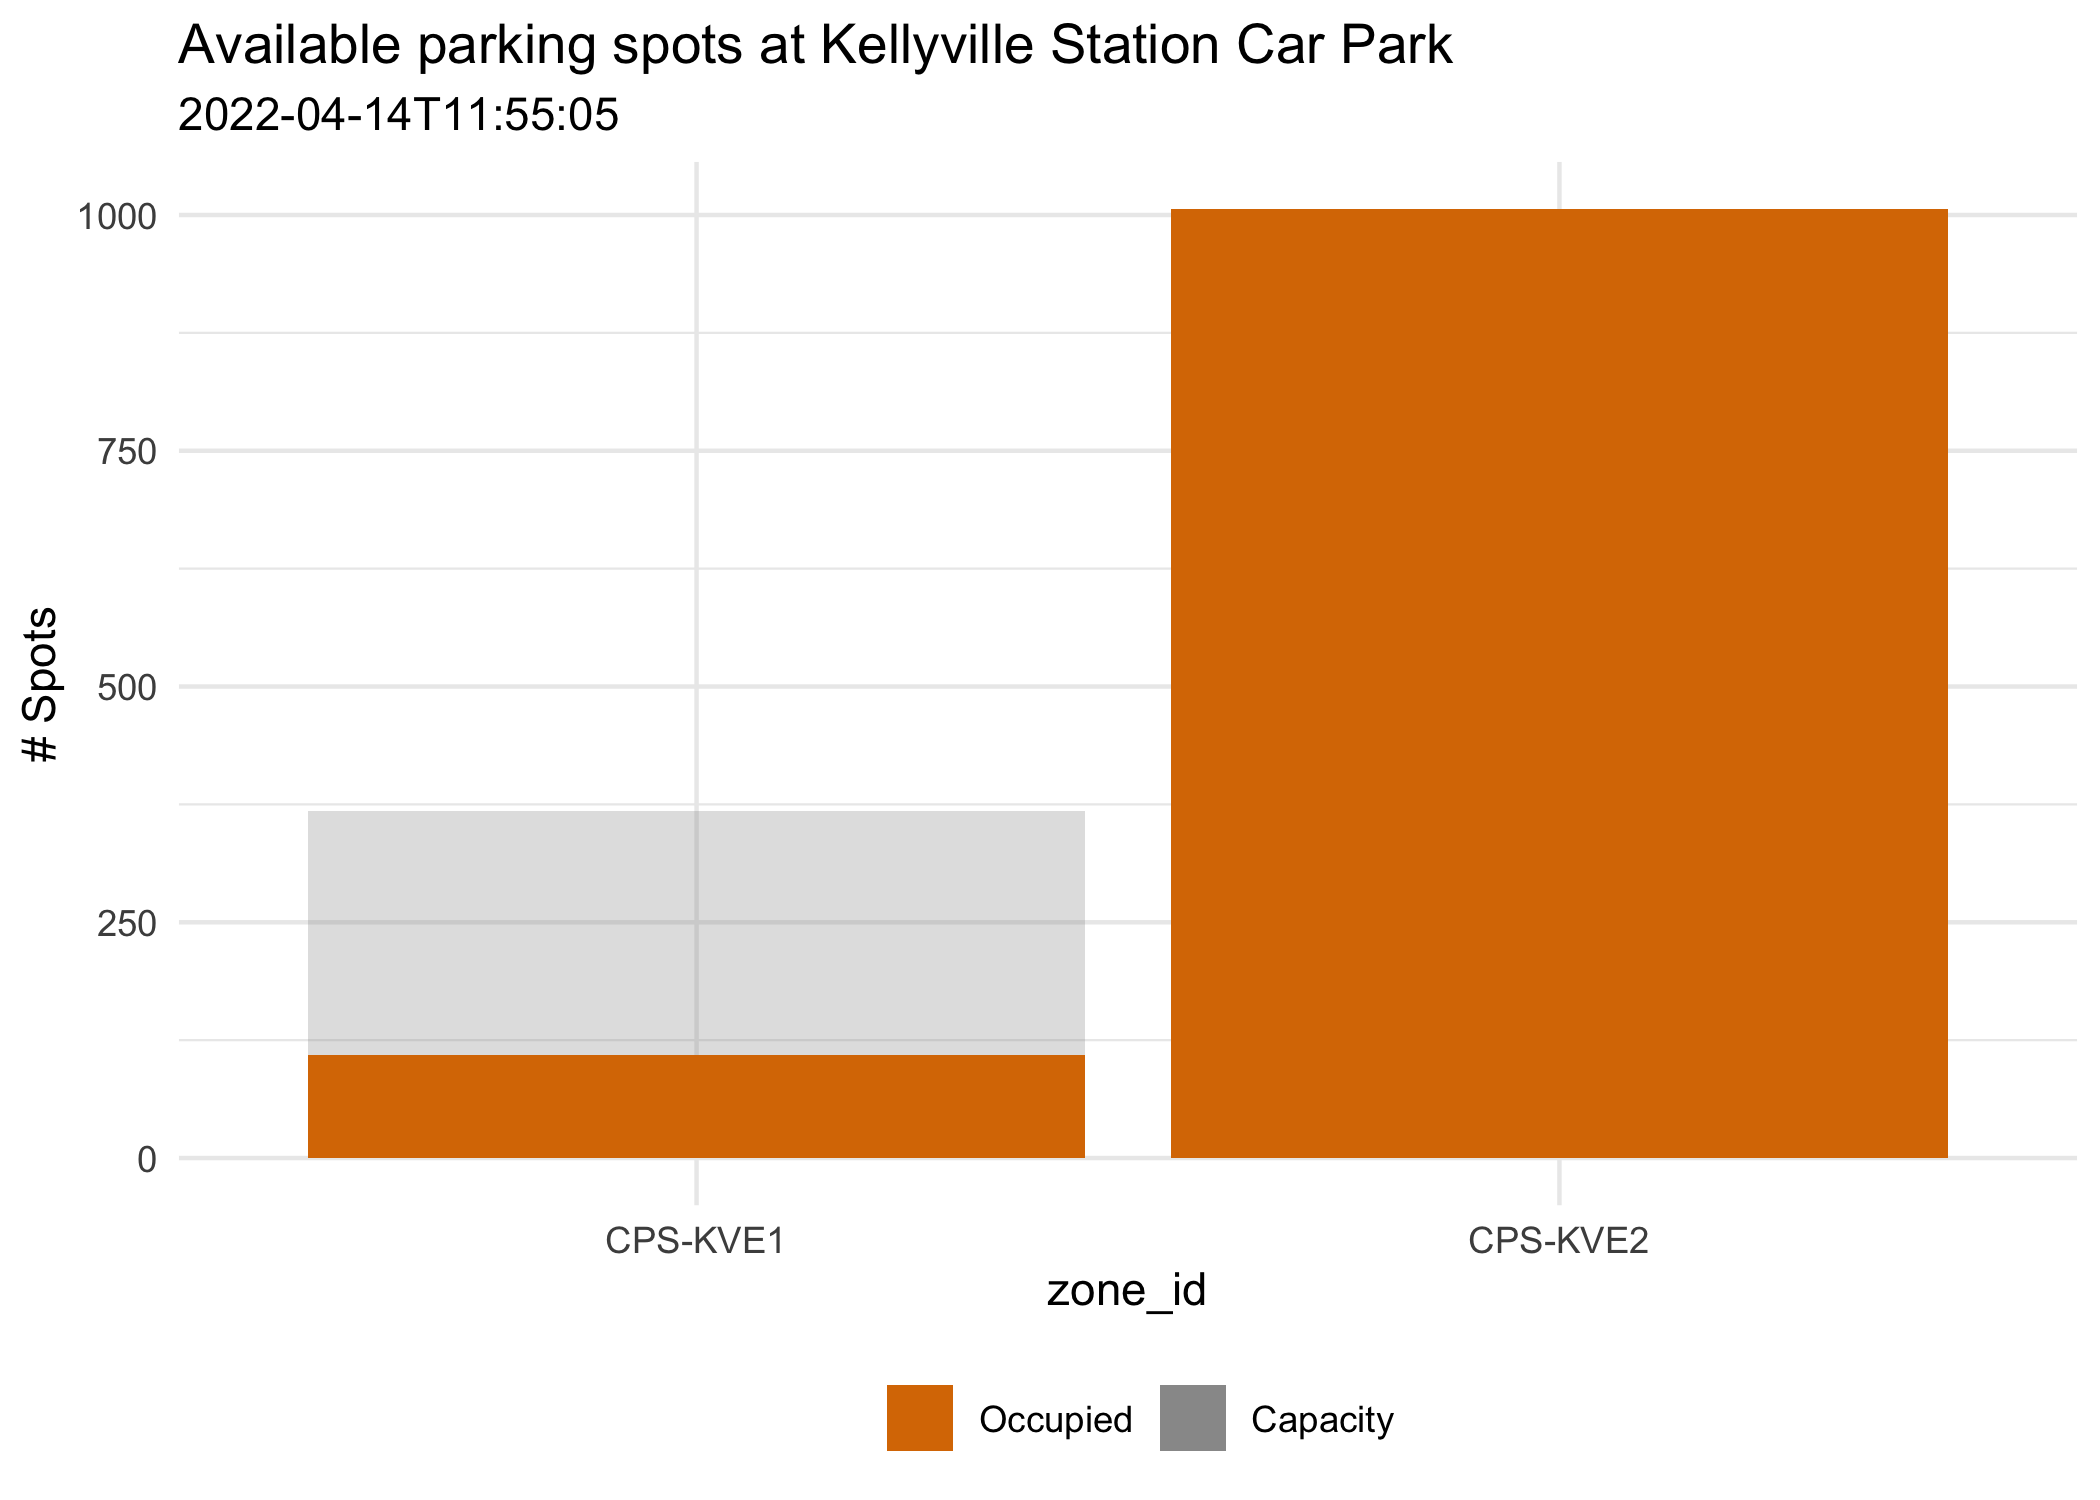
ggplot(data = tidied_carpark, aes(x = zone_id)) +
  geom_col(aes(y = as.integer(total_spots), fill = "Capacity"), alpha = 0.3) +
  geom_col(aes(y = as.integer(occupied_spots), fill = "Occupied")) +
  theme_minimal() +
  scale_fill_manual(values = c("Occupied" = "#DA7800", "Capacity" = "grey60")) +
  theme(legend.position = "bottom") +
  labs(
    title = paste("Available parking spots at", carpark$content$facility_name),
    subtitle = carpark$content$MessageDate,
    y = "# Spots",
    fill = ""
  )
GTFS Realtime API
See TfNSW GTFS Realtime documentation here.
library(tfnswapi)
library(ggplot2)
library(ggmap)
library(data.table)
library(sf)

# remove `if (FALSE)` to register your own API key
if (FALSE) {
  tfnswapi_register("<your-api-key>")
}

bus_response <- tfnswapi_get("gtfs/vehiclepos/buses")
bus_position_table <- data.table::as.data.table(bus_response$content$entity$vehicle$position)

bus_position_table <-
  bus_position_table %>%
  .[!is.na(longitude), ] %>%
  sf::st_as_sf(coords = c("longitude", "latitude")) %>%
  sf::st_set_crs(value = sf::st_crs("WGS84"))

# Convert momentary speed measured by the vehicle in meters per second to
# kilometers per hour
bus_position_table$speed <- 3.6 * bus_position_table$speed

# get base map
sydney_bbox <- sf::st_geometry(bus_position_table) %>% sf::st_bbox()
names(sydney_bbox) <- c("left", "bottom", "right", "top")
sydney_map <- get_stamenmap(sydney_bbox, maptype = "toner-lite", messaging = FALSE)

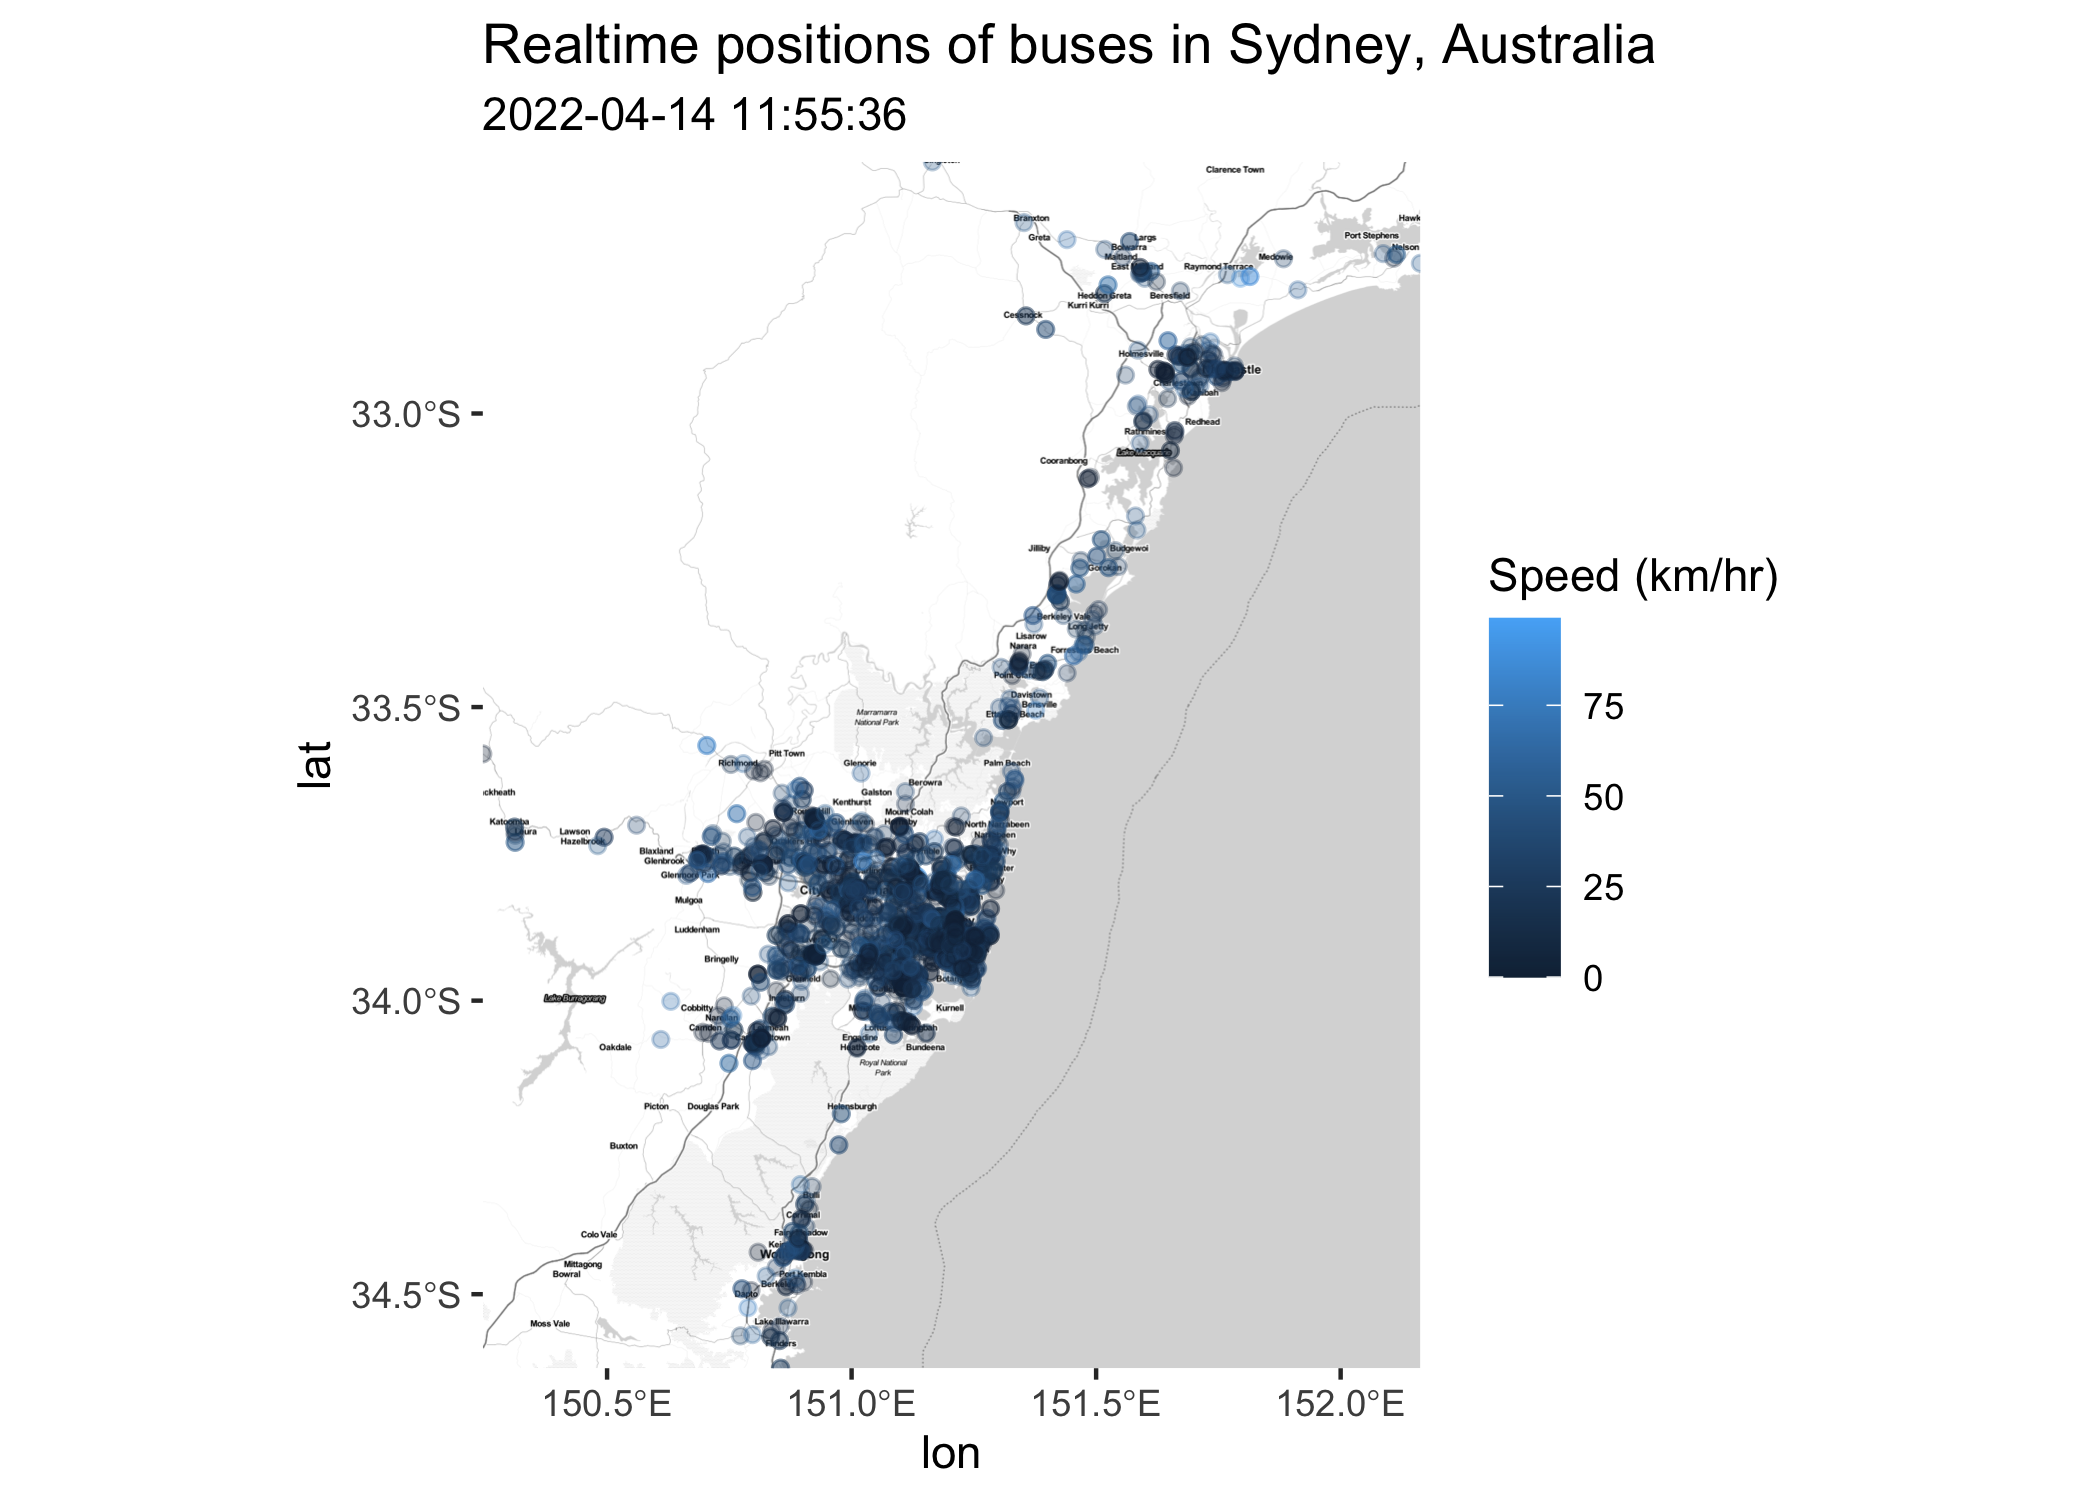
ggmap(sydney_map) +
  coord_sf(crs = sf::st_crs("WGS84")) +
  geom_sf(data = bus_position_table, aes(color = speed), alpha = 0.3, inherit.aes = FALSE) +
  labs(
    title = "Realtime positions of buses in Sydney, Australia",
    color = "Speed (km/hr)",
    subtitle = format(bus_response$date, tz = "Australia/Sydney")
  )
Animate GTFS Realtime data
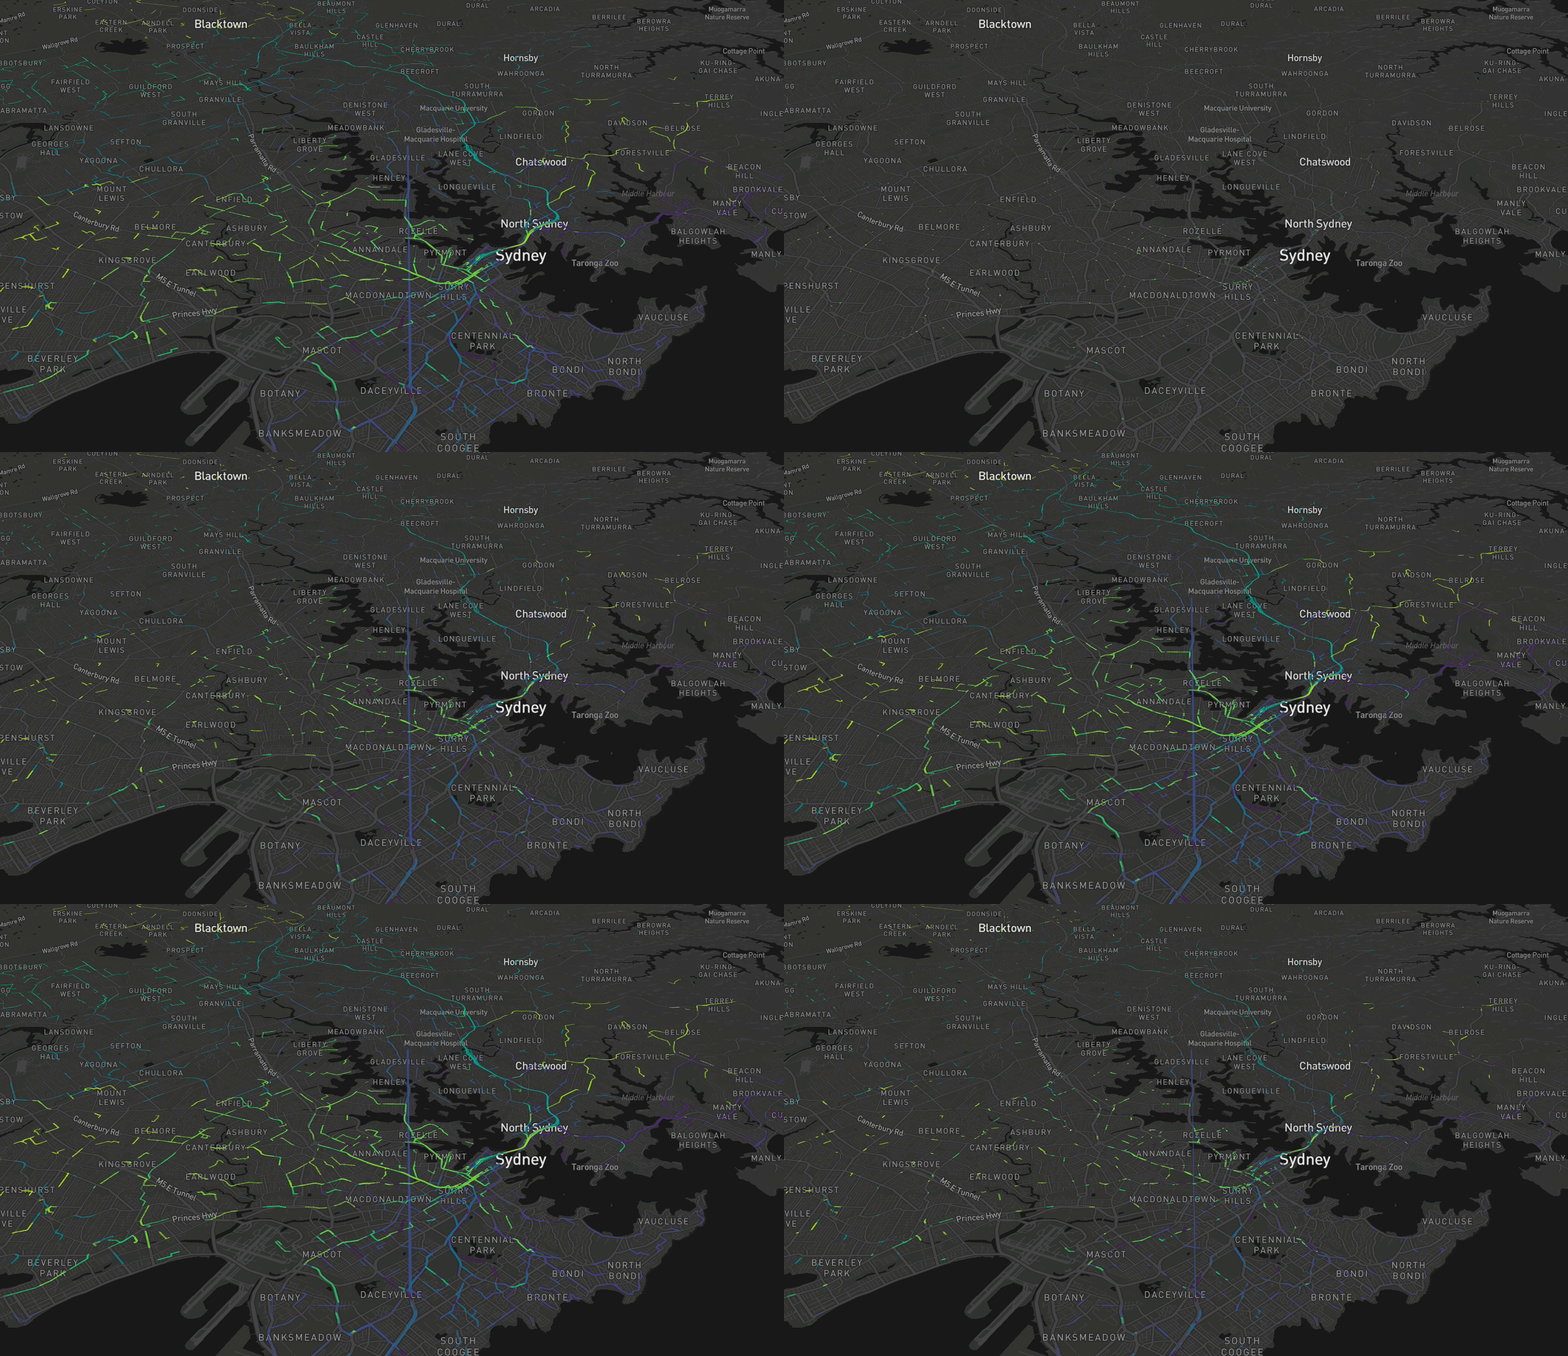
Animate GTFS Realtime data with mapdeck.
library(tfnswapi)
library(data.table)
library(sf)
library(mapdeck)
library(sfheaders)

# remove `if (FALSE)` to register your own API key
if (FALSE) {
  tfnswapi_register("<your-api-key>")
}

# query GTFS realtime 20 times, 5 seconds between each request.
n <- 30
bus_responses <- lapply(1:n, function(x) {
  Sys.sleep(5)
  tfnswapi_get("gtfs/vehiclepos/buses")
})

# tidy the vehicle position data
bus_position_tables <- lapply(1:n, function(x) {
  .data <- bus_responses[[x]]$content$entity$vehicle$position
  .data[["vehicle_id"]] <- bus_responses[[x]]$content$entity$vehicle$vehicle$id
  .data[["timestep"]] <- x
  .data
}) %>%
  data.table::rbindlist() %>%
  data.table::setorder(vehicle_id) %>%
  .[, elev := 0] %>%
  .[!is.na(latitude)]

# convert it into sf
bus_position_sfc <- sfheaders::sfc_linestring(
  obj = bus_position_tables,
  x = "longitude",
  y = "latitude",
  z = "elev",
  m = "timestep",
  linestring_id = "vehicle_id"
)

bus_position_sf <-
  sf::st_as_sf(
    bus_position_tables[
      bus_position_tables[, .I[1], by = vehicle_id]$V1,
      .(vehicle_id, bearing, speed)
    ],
    bus_position_sfc
  )

# visualise
mapdeck(style = mapdeck_style("dark")) %>%
  add_trips(
    data = bus_position_sf,
    stroke_colour = "vehicle_id",
    animation_speed = 10
  )
